Stratification in polygenic scores (grid-like structure)
Last updated: 2020-12-22
Checks: 6 1
Knit directory: popstruct_scripts/
This reproducible R Markdown analysis was created with workflowr (version 1.6.2). The Checks tab describes the reproducibility checks that were applied when the results were created. The Past versions tab lists the development history.
The R Markdown is untracked by Git. To know which version of the R Markdown file created these results, you’ll want to first commit it to the Git repo. If you’re still working on the analysis, you can ignore this warning. When you’re finished, you can run wflow_publish to commit the R Markdown file and build the HTML.
Great job! The global environment was empty. Objects defined in the global environment can affect the analysis in your R Markdown file in unknown ways. For reproduciblity it’s best to always run the code in an empty environment.
The command set.seed(20201202) was run prior to running the code in the R Markdown file. Setting a seed ensures that any results that rely on randomness, e.g. subsampling or permutations, are reproducible.
Great job! Recording the operating system, R version, and package versions is critical for reproducibility.
Nice! There were no cached chunks for this analysis, so you can be confident that you successfully produced the results during this run.
Great job! Using relative paths to the files within your workflowr project makes it easier to run your code on other machines.
Great! You are using Git for version control. Tracking code development and connecting the code version to the results is critical for reproducibility.
The results in this page were generated with repository version 5bce003. See the Past versions tab to see a history of the changes made to the R Markdown and HTML files.
Note that you need to be careful to ensure that all relevant files for the analysis have been committed to Git prior to generating the results (you can use wflow_publish or wflow_git_commit). workflowr only checks the R Markdown file, but you know if there are other scripts or data files that it depends on. Below is the status of the Git repository when the results were generated:
Ignored files:
    Ignored:    .DS_Store
    Ignored:    .Rproj.user/
    Ignored:    analysis/.DS_Store
    Ignored:    code/.DS_Store
    Ignored:    data/.DS_Store
    Ignored:    data/burden_msprime/
    Ignored:    data/burden_msprime2/
    Ignored:    data/gwas/
    Ignored:    data/ukmap/
    Ignored:    output/plots/

Untracked files:
    Untracked:  analysis/biasvaccuracy_prsascertainment.Rmd
    Untracked:  analysis/plotting_prs_sib_effects.Rmd
    Untracked:  analysis/plottingprs_distribution_gridt.Rmd
    Untracked:  analysis/plt_burden_association.Rmd
    Untracked:  analysis/plt_gwas_results_t9.Rmd
    Untracked:  analysis/plt_ukb_unrelated_prs.Rmd
    Untracked:  analysis/prs_wt_finemapping.Rmd
    Untracked:  code/burden_msprime/
    Untracked:  code/fine_mapping/
    Untracked:  code/germline_ibd/
    Untracked:  code/gwas/
    Untracked:  code/imputation/
    Untracked:  code/optimize_migration_rate/
    Untracked:  code/pca_plots/
    Untracked:  code/prs/
    Untracked:  code/qqplots/
    Untracked:  code/revisions/
    Untracked:  code/shared_scripts/
    Untracked:  code/sib_analysis/
    Untracked:  code/simulating_genotypes/
    Untracked:  code/simulating_phenotypes/

Unstaged changes:
    Modified:   README.md
    Modified:   analysis/Simulating_heritable_phenotypes.Rmd
    Deleted:    analysis/Simulating_heritable_phenotypes.nb.html
    Modified:   analysis/_site.yml
    Modified:   analysis/index.Rmd
    Modified:   analysis/plt_PCA.Rmd
    Deleted:    analysis/plt_PCA.nb.html
    Modified:   analysis/plt_burden_clustering.Rmd
    Deleted:    analysis/plt_burden_clustering.nb.html
    Modified:   analysis/plt_lambda_v_frequency_ukb.Rmd
    Deleted:    analysis/plt_lambda_v_frequency_ukb.nb.html
    Deleted:    burden_msprime/.ipynb_checkpoints/Untitled-Copy1-checkpoint.ipynb
    Deleted:    burden_msprime/.ipynb_checkpoints/Untitled-checkpoint.ipynb
    Deleted:    burden_msprime/Notes_burden_msprime.txt
    Deleted:    burden_msprime/Untitled-Copy1.ipynb
    Deleted:    burden_msprime/Untitled.ipynb
    Deleted:    burden_msprime/burden_association_tests_norecomb.Rmd
    Deleted:    burden_msprime/burden_association_tests_norecomb.nb.html
    Deleted:    burden_msprime/burden_clustering.Rmd
    Deleted:    burden_msprime/burden_clustering.nb.html
    Deleted:    burden_msprime/burden_illustration.R
    Deleted:    burden_msprime/burden_test.haps.npz
    Deleted:    burden_msprime/generate_burden/burden_association.py
    Deleted:    burden_msprime/generate_burden/burden_gini.py
    Deleted:    burden_msprime/generate_burden/burden_gwas.txt
    Deleted:    burden_msprime/generate_burden/generate_burden_t100.py
    Deleted:    burden_msprime/generate_burden/generate_burden_t9.py
    Deleted:    burden_msprime/generate_burden/msprime_genic_burden_gini_nointrons_g_rho.py
    Deleted:    burden_msprime/generate_burden/msprime_genic_burden_t_r_x.py
    Deleted:    burden_msprime/generate_burden/wrapper_burden_association.sh
    Deleted:    burden_msprime/generate_burden/wrapper_burden_gini.sh
    Deleted:    burden_msprime/generate_burden/wrapper_generate_burden.sh
    Deleted:    burden_msprime/genos_gridt100_l1e7_ss750_m0.05_chr1_20.rmdup.train.cm.200k.eigenvec
    Deleted:    burden_msprime/genos_gridt100_l1e7_ss750_m0.05_chr1_20.rmdup.train.re.all.eigenvec
    Deleted:    burden_msprime/iid_train.txt
    Deleted:    burden_msprime/pheno_gridt100_noge_s9k.train.1.txt
    Deleted:    burden_msprime/plt_burden_association_t100.Rmd
    Deleted:    burden_msprime/plt_burden_association_t100.nb.html
    Deleted:    burden_msprime/plt_burden_association_t9.Rmd
    Deleted:    burden_msprime/plt_burden_association_t9.nb.html
    Deleted:    burden_msprime/plt_burden_clustering.Rmd
    Deleted:    burden_msprime/plt_burden_clustering.nb.html
    Deleted:    fine_mapping/comparing_susie_effects.R
    Deleted:    fine_mapping/comparing_susie_vs_ct.R
    Deleted:    fine_mapping/finemap.R
    Deleted:    fine_mapping/generate_genomic_coordinates_for_windows.R
    Deleted:    fine_mapping/generate_ldmat.sh
    Deleted:    fine_mapping/prs_wt_susie.Rmd
    Deleted:    fine_mapping/prs_wt_susie.nb.html
    Deleted:    fine_mapping/prs_wt_susie.sh
    Deleted:    fine_mapping/susie.R
    Deleted:    fine_mapping/wrapper_susie.sh
    Deleted:    germline_ibd/make_grm.R
    Deleted:    germline_ibd/proc_germline.R
    Deleted:    gwas/grid/notes_on_subsetting_snps_from_tau9.txt
    Deleted:    gwas/grid/tau-9/blmm.sh
    Deleted:    gwas/grid/tau-9/gcta_mlma_gridt9.sh
    Deleted:    gwas/grid/tau-9/gwas_wrapper_gridt-9_noge.sh
    Deleted:    gwas/grid/tau-9/gwas_wrapper_gridt9_ge.sh
    Deleted:    gwas/grid/tau-9/gwas_wrapper_gridt9_ge_geo.sh
    Deleted:    gwas/grid/tau-9/gwas_wrapper_gridt9_ge_re2.sh
    Deleted:    gwas/grid/tau-9/gwas_wrapper_gridt9_ge_repruned2.sh
    Deleted:    gwas/grid/tau-9/paste_cmre_pca.sh
    Deleted:    gwas/grid/tau-9/plot_prs_all.R
    Deleted:    gwas/grid/tau-9/processgwas4qq.R
    Deleted:    gwas/grid/tau-9/prs_wrapper.sh
    Deleted:    gwas/grid/tau-9/prs_wrapper2.sh
    Deleted:    gwas/grid/tau-9/prs_wrapper3.sh
    Deleted:    gwas/grid/tau-9/scripts/generate_genotypes/pca.sh
    Deleted:    gwas/grid/tau-9/scripts/generate_genotypes/vcf2plink.sh
    Deleted:    gwas/grid/tau-9/scripts/gwas/gwas.sh
    Deleted:    gwas/grid/tau-9/scripts/prs/cal_prs.sh
    Deleted:    gwas/grid/tau-9/scripts/prs/cal_prs2.sh
    Deleted:    gwas/grid/tau-9/scripts/prs/cal_prs3.sh
    Deleted:    gwas/grid/tau-9/scripts/prs/clump.R
    Deleted:    gwas/grid/tau-9/scripts/prs/clump2.R
    Deleted:    gwas/grid/tau-9/scripts/prs/clump3.R
    Deleted:    gwas/grid/tau-9/scripts/simphenotype/simgeffects.R
    Deleted:    gwas/grid/tau-9/scripts/simphenotype/simphenotype_ge.R
    Deleted:    gwas/grid/tau-9/scripts/simphenotype/simphenotype_ge_wrapper.sh
    Deleted:    gwas/grid/tau-9/scripts/simphenotype/simphenotype_noge.R
    Deleted:    gwas/grid/tau-9/simphenotype_noge.R
    Deleted:    gwas/grid/tau-9/split_beds.R
    Deleted:    gwas/grid/tau-9/wrapper_processqq_gridt9.sh
    Deleted:    gwas/grid/tau100/blmm.sh
    Deleted:    gwas/grid/tau100/blmm_nopc.sh
    Deleted:    gwas/grid/tau100/cat_gwas_sib.sh
    Deleted:    gwas/grid/tau100/cat_prs_sibs.sh
    Deleted:    gwas/grid/tau100/fastgwa.sh
    Deleted:    gwas/grid/tau100/gcta_mlma_gridt100_ge.sh
    Deleted:    gwas/grid/tau100/gctaloco_mlma_gridt100_ge.sh
    Deleted:    gwas/grid/tau100/gctaloco_mlma_gridt100_noge.sh
    Deleted:    gwas/grid/tau100/gwas_ge_incombined_sample.sh
    Deleted:    gwas/grid/tau100/gwas_wrapper_gridt100_ge.sh
    Deleted:    gwas/grid/tau100/gwas_wrapper_gridt100_ge_test.sh
    Deleted:    gwas/grid/tau100/lmmloco_wrapper_gridt100_ge.sh
    Deleted:    gwas/grid/tau100/lmmloco_wrapper_gridt100_noge.sh
    Deleted:    gwas/grid/tau100/locowrap_ge.sh
    Deleted:    gwas/grid/tau100/locowrap_noge.sh
    Deleted:    gwas/grid/tau100/paste_cmre_pca.sh
    Deleted:    gwas/grid/tau100/plot_prs_all.R
    Deleted:    gwas/grid/tau100/plot_prs_all_t100.R
    Deleted:    gwas/grid/tau100/prs_wrapper.sh
    Deleted:    gwas/grid/tau100/prs_wrapper_mlma.sh
    Deleted:    gwas/grid/tau100/prs_wrapper_sibs.sh
    Deleted:    gwas/grid/tau100/prs_wrapper_sibs_ascertained.sh
    Deleted:    gwas/grid/tau100/scripts/generate_genotypes/pca.sh
    Deleted:    gwas/grid/tau100/scripts/generate_genotypes/vcf2plink.sh
    Deleted:    gwas/grid/tau100/scripts/gwas/gwas.sh
    Deleted:    gwas/grid/tau100/scripts/prs/ascertain_effects.R
    Deleted:    gwas/grid/tau100/scripts/prs/cal_prs.sh
    Deleted:    gwas/grid/tau100/scripts/prs/cal_prs_mlma.sh
    Deleted:    gwas/grid/tau100/scripts/prs/cal_prs_sibs.sh
    Deleted:    gwas/grid/tau100/scripts/prs/cal_prs_sibs_ascertained.sh
    Deleted:    gwas/grid/tau100/scripts/prs/clump.R
    Deleted:    gwas/grid/tau100/scripts/prs/clump_mlma.R
    Deleted:    gwas/grid/tau100/scripts/prs/clump_pcs0.R
    Deleted:    gwas/grid/tau100/scripts/prs/clump_sibs.R
    Deleted:    gwas/grid/tau100/scripts/simphenotype/simgeffects.R
    Deleted:    gwas/grid/tau100/scripts/simphenotype/simphenotype_ge.R
    Deleted:    gwas/grid/tau100/scripts/simphenotype/simphenotype_ge_wrapper.sh
    Deleted:    gwas/grid/tau100/scripts/simphenotype/simphenotype_noge.R
    Deleted:    gwas/investigating_prs_ns_complexdem.Rmd
    Deleted:    gwas/investigating_prs_ns_complexdem.nb.html
    Deleted:    gwas/investigating_prs_ns_complexdem2.Rmd
    Deleted:    gwas/investigating_prs_ns_complexdem2.nb.html
    Deleted:    gwas/investigating_prs_ns_structure.Rmd
    Deleted:    gwas/investigating_prs_ns_structure.nb.html
    Deleted:    gwas/ukb/.ipynb_checkpoints/Untitled-checkpoint.ipynb
    Deleted:    gwas/ukb/Untitled.ipynb
    Deleted:    gwas/ukb/gwas_wrapper_ukb_ge.sh
    Deleted:    gwas/ukb/paste_cmre_pca.sh
    Deleted:    gwas/ukb/paste_cmre_pca_ukb.sh
    Deleted:    gwas/ukb/prs_wrapper.sh
    Deleted:    gwas/ukb/scripts/gwas/gwas.sh
    Deleted:    gwas/ukb/scripts/prs/cal_prs.sh
    Deleted:    gwas/ukb/scripts/prs/clump.R
    Deleted:    gwas/ukb/scripts/simphenotype/simgeffects.R
    Deleted:    gwas/ukb/scripts/simphenotype/simphenotype_ge.R
    Deleted:    gwas/ukb/scripts/simphenotype/simphenotype_ge_wrapper.sh
    Deleted:    gwas/ukb/scripts/simphenotype/simphenotype_noge.R
    Deleted:    gwas/ukb/scripts/simphenotype/simphenotype_noge_wrapper.sh
    Deleted:    imputation/extract_beagle_info.sh
    Deleted:    imputation/imputation_v_rarePCA.Rmd
    Deleted:    imputation/imputation_v_rarePCA.nb.html
    Deleted:    imputation/pca_on_imputed_genotypes.sh
    Deleted:    imputation/wrapper_beagle.sh
    Deleted:    imputation/wrapper_imputation.sh
    Deleted:    optimize_migration_rate/Fst_plots.R
    Deleted:    optimize_migration_rate/bplace_gwas.R
    Deleted:    optimize_migration_rate/complex_dem/bplacegwas_fst_grid.sh
    Deleted:    optimize_migration_rate/complex_dem/cal_fst.py
    Deleted:    optimize_migration_rate/complex_dem/complex_dem.py
    Deleted:    optimize_migration_rate/complex_dem/complex_dem_2.py
    Deleted:    optimize_migration_rate/complex_dem/complex_dem_bplace_wrapper.sh
    Deleted:    optimize_migration_rate/complex_dem/opt_lambda_complexdem.Rmd
    Deleted:    optimize_migration_rate/complex_dem/opt_lambda_complexdem.nb.html
    Deleted:    optimize_migration_rate/grid/tau-9/grid_bplace_wrapper.sh
    Deleted:    optimize_migration_rate/grid/tau100/grid_bplace_wrapper.sh
    Deleted:    pca_plots/Effect_of_using_cmre_together_pca.Rmd
    Deleted:    pca_plots/collinearity_bw_cmandrare_pcs.Rmd
    Deleted:    pca_plots/collinearity_bw_cmandrare_pcs.nb.html
    Deleted:    pca_plots/plt_complex_pca.R
    Deleted:    pca_plots/plt_pca.R
    Deleted:    prs/analyze_true_geneticeffects_out_o_sample.Rmd
    Deleted:    prs/biasvaccuracy_prsascertainment.Rmd
    Deleted:    prs/biasvaccuracy_prsascertainment.nb.html
    Deleted:    prs/clump_3.R
    Deleted:    prs/complex_dem/Plotting_esizes_and_prs.Rmd
    Deleted:    prs/complex_dem/Plotting_esizes_and_prs.nb.html
    Deleted:    prs/complex_dem/investigating_ns_strat.R
    Deleted:    prs/complex_dem/plotting_prs_from_sibeffects.Rmd
    Deleted:    prs/complex_dem/plotting_prs_from_sibeffects.nb.html
    Deleted:    prs/complex_dem/plottingprs_distribution_complex.Rmd
    Deleted:    prs/complex_dem/plottingprs_distribution_complex.nb.html
    Deleted:    prs/grid/plottingprs_distribution_gridt.Rmd
    Deleted:    prs/grid/plottingprs_distribution_gridt.nb.html
    Deleted:    prs/grid/tau100/Plotting_esizes_and_prs.Rmd
    Deleted:    prs/grid/tau100/Plotting_esizes_and_prs.nb.html
    Deleted:    prs/grid/tau100/plotting_prs_mlma.Rmd
    Deleted:    prs/grid/tau100/plotting_prs_mlma.nb.html
    Deleted:    prs/grid/tau100/plotting_prs_sib_effects.Rmd
    Deleted:    prs/grid/tau100/plotting_prs_sib_effects.nb.html
    Deleted:    prs/grid/tau100/plottingprs_distribution_gridt100.Rmd
    Deleted:    prs/grid/tau100/plottingprs_distribution_gridt100.nb.html
    Deleted:    prs/plot_expvobs_prs_4.R
    Deleted:    prs/plot_r2_rlat_supplement.Rmd
    Deleted:    prs/plot_r2_rlat_supplement.nb.html
    Deleted:    prs/prs_test_wrapper.sh
    Deleted:    prs/simulating_genetic_effects_prs
    Deleted:    prs/ukb/plt_ukb_unrelated_prs.Rmd
    Deleted:    prs/ukb/plt_ukb_unrelated_prs.nb.html
    Deleted:    prs/ukb/plt_ukb_unrelated_prs_uniform.Rmd
    Deleted:    prs/ukb/plt_ukb_unrelated_prs_uniform.nb.html
    Deleted:    qqplots/GWAS_qqdetails.txt
    Deleted:    qqplots/fixed_effects/plt_gwas_results_t100_all.Rmd
    Deleted:    qqplots/fixed_effects/plt_gwas_results_t9_07062020.Rmd
    Deleted:    qqplots/fixed_effects/plt_gwas_results_t9_07062020.nb.html
    Deleted:    qqplots/fixed_effects/plt_gwas_results_ti_all.Rmd
    Deleted:    qqplots/fixed_effects/plt_lambda_v_frequency.Rmd
    Deleted:    qqplots/fixed_effects/plt_lambda_v_frequency.nb.html
    Deleted:    qqplots/fixed_effects/plt_lambda_v_frequency_ukb.Rmd
    Deleted:    qqplots/fixed_effects/plt_lambda_v_frequency_ukb.nb.html
    Deleted:    qqplots/fixed_effects/scripts/plot_panels.R
    Deleted:    qqplots/fixed_effects/scripts/plot_panels_t100.R
    Deleted:    qqplots/fixed_effects/scripts/plot_panels_t9.R
    Deleted:    qqplots/fixed_effects/scripts/processgwas4qq.R
    Deleted:    qqplots/fixed_effects/scripts/wrapper_processqq_gridt100.sh
    Deleted:    qqplots/lmms/plt_gridt100_blmm.Rmd
    Deleted:    qqplots/lmms/plt_gridt100_blmm.nb.html
    Deleted:    qqplots/lmms/plt_gridt100_mlma.Rmd
    Deleted:    qqplots/lmms/plt_gridt100_mlma.nb.html
    Deleted:    qqplots/lmms/plt_gridt9_mlma.Rmd
    Deleted:    qqplots/lmms/plt_gridt9_mlma.nb.html
    Deleted:    qqplots/lmms/processgwas4qq_lmm.R
    Deleted:    qqplots/lmms/wrapper_processqq_gridt100.sh
    Deleted:    revisions/PCA_v_frequency_bracket_gridt100.sh
    Deleted:    revisions/PCA_v_frequency_bracket_ukb.sh
    Deleted:    revisions/PCA_v_number_of_cm_variants.sh
    Deleted:    revisions/ascertainment_schemes_prs_prediction.Rmd
    Deleted:    revisions/ascertainment_schemes_prs_prediction.nb.html
    Deleted:    revisions/calculate_prs_with_discoveryeffects.sh
    Deleted:    revisions/comparing_gvalues.R
    Deleted:    revisions/compute_genetic_values.sh
    Deleted:    revisions/compute_prs_a1_r2_p3.sh
    Deleted:    revisions/compute_prs_a1_r3s_p2.sh
    Deleted:    revisions/compute_prs_a3s_r1_p2.sh
    Deleted:    revisions/compute_prs_a3s_r2_p1.sh
    Deleted:    revisions/figuring_out_prediction_accuracy.Rmd
    Deleted:    revisions/figuring_out_prediction_accuracy.nb.html
    Deleted:    revisions/figuring_out_prediction_accuracy2.Rmd
    Deleted:    revisions/figuring_out_prediction_accuracy2.nb.html
    Deleted:    revisions/germline_ukb.sh
    Deleted:    revisions/rm_rare.sh
    Deleted:    shared_scripts/ascertain_effects.R
    Deleted:    shared_scripts/cal_prs.sh
    Deleted:    shared_scripts/cal_prs_mlma.sh
    Deleted:    shared_scripts/cal_prs_sibs.sh
    Deleted:    shared_scripts/cal_prs_sibs_ascertained.sh
    Deleted:    shared_scripts/clump.R
    Deleted:    shared_scripts/clump_mlma.R
    Deleted:    shared_scripts/clump_sibs.R
    Deleted:    shared_scripts/gen_map.R
    Deleted:    shared_scripts/get_se.R
    Deleted:    shared_scripts/gwas.sh
    Deleted:    shared_scripts/re_estimate_effects.R
    Deleted:    shared_scripts/simgeffects.R
    Deleted:    shared_scripts/simphenotype_ge.R
    Deleted:    shared_scripts/simphenotype_ge_wrapper.sh
    Deleted:    shared_scripts/simphenotype_noge.R
    Deleted:    sib_analysis/complex_dem/.ipynb_checkpoints/Sibling gwas - practice-checkpoint.ipynb
    Deleted:    sib_analysis/complex_dem/Sibling gwas - practice.ipynb
    Deleted:    sib_analysis/complex_dem/cat_sibs.sh
    Deleted:    sib_analysis/complex_dem/edit_fam.R
    Deleted:    sib_analysis/complex_dem/generate_gvalue_sib.py
    Deleted:    sib_analysis/complex_dem/generate_gvalue_sib_wrap.sh
    Deleted:    sib_analysis/complex_dem/generate_sib_phenotypes.sh
    Deleted:    sib_analysis/complex_dem/gwas_sib_complex_wrapper.sh
    Deleted:    sib_analysis/complex_dem/make_sib_haplotypes.py
    Deleted:    sib_analysis/complex_dem/mate4sibs.py
    Deleted:    sib_analysis/complex_dem/sib_gwas.py
    Deleted:    sib_analysis/complex_dem/simphenotype_sibs_ge.R
    Deleted:    sib_analysis/complex_dem/wrapper_generate_sib_haplotypes.sh
    Deleted:    sib_analysis/grid/tau100/generate_gvalue_sib.py
    Deleted:    sib_analysis/grid/tau100/generate_gvalue_sib_wrap.sh
    Deleted:    sib_analysis/grid/tau100/generate_sib_phenotypes.sh
    Deleted:    sib_analysis/grid/tau100/gwas_sib_grid_wrapper.sh
    Deleted:    sib_analysis/grid/tau100/make_sib_haplotypes.py
    Deleted:    sib_analysis/grid/tau100/mate4sibs.py
    Deleted:    sib_analysis/grid/tau100/sib_gwas.py
    Deleted:    sib_analysis/grid/tau100/simphenotype_sibs_ge.R
    Deleted:    sib_analysis/grid/tau100/wrap_gwas_reps.sh
    Deleted:    sib_analysis/grid/tau100/wrapper_generate_sib_haplotypes.sh
    Deleted:    simulating_genotypes/grid/generate_genos_grid.py
    Deleted:    simulating_genotypes/grid/simulating_and_processing_genotypes_t100.txt
    Deleted:    simulating_genotypes/grid/simulating_and_processing_genotypes_t9.txt
    Deleted:    simulating_genotypes/grid/tau-9/generate_genos_gridt9_wrapper.sh
    Deleted:    simulating_genotypes/grid/tau-9/generate_popfile_t9.R
    Deleted:    simulating_genotypes/grid/tau-9/pca_t9.sh
    Deleted:    simulating_genotypes/grid/tau-9/vcf2plink_t9.sh
    Deleted:    simulating_genotypes/grid/tau100/generate_genos_gridt100_wrapper.sh
    Deleted:    simulating_genotypes/grid/tau100/generate_popfile_t100.R
    Deleted:    simulating_genotypes/grid/tau100/pca_t100.sh
    Deleted:    simulating_genotypes/grid/tau100/pca_t100_test.sh
    Deleted:    simulating_genotypes/grid/tau100/vcf2plink_t100.sh
    Deleted:    simulating_genotypes/ukb/generate_genos_ukb.py
    Deleted:    simulating_genotypes/ukb/generate_pop_ukb.R
    Deleted:    simulating_genotypes/ukb/pca_ukb.sh
    Deleted:    simulating_genotypes/ukb/uk_nuts2_adj.txt
    Deleted:    simulating_genotypes/ukb/uk_nuts2_adj_ids.txt
    Deleted:    simulating_genotypes/ukb/ukb_gengeno_wrapper_1.sh
    Deleted:    simulating_genotypes/ukb/vcf2plink_ukb.sh
    Deleted:    simulating_phenotypes/Simulating_heritable_phenotypes.Rmd
    Deleted:    simulating_phenotypes/Simulating_heritable_phenotypes.nb.html
Note that any generated files, e.g. HTML, png, CSS, etc., are not included in this status report because it is ok for generated content to have uncommitted changes.
These are the previous versions of the repository in which changes were made to the R Markdown (analysis/plottingprs_distribution_gridt.Rmd) and HTML (docs/plottingprs_distribution_gridt.html) files. If you’ve configured a remote Git repository (see ?wflow_git_remote), click on the hyperlinks in the table below to view the files as they were in that past version.
| File | Version | Author | Date | Message |
|---|---|---|---|---|
| html | 5bce003 | Arslan-Zaidi | 2020-12-22 | added wflow builds |
Introduction
Here, I’ll be plotting the spatial distribution of polygenic scores based on effect sizes estimated from a GWAS in a population with a lattice-grid arrangement of demes.
library(ggplot2)
library(dplyr)
library(data.table)
library(rprojroot)
library(patchwork)

#specify root of the directory
F = is_rstudio_project$make_fix_file()

options(dplyr.summarise.inform=FALSE)
Implementation
Write a function to plot the polygenic score distribution for each phenotype separately. Briefly, the function will do the following things:
1: First,load the predicted polygenic scores based on effect sizes that are: (i) causal and have a pvalue of 5e-04 or smaller (named ‘causal’) (ii) the topmost significant SNP (‘lead SNP’) within each 100Kb window around the causal variant with the condition that the lead SNP has a pvalue of 5e-04 or smaller.
2: Load each individual’s true genetic value and subtract it out of the polygenic score. This is important because there might be some structure in the genetic value itself because of the simulated demography and we are only interested in any residual structure due to residual stratification.
For visualization, plot the mean polygenic score per deme. The mean averages out stochastic noise in the polygenic score, making systematic patterns more apparent.
Plot
Write function to do all these things.
fmake_plots= function(pheno,tau,plot_title){

  if(tau==100){
    #load the genetic value
    gvalue_df = fread(F(paste("data/gwas/grid/genotypes/tau100/ss500/test/gvalue/genos_grid_d36_m0.05_s500_t100.rmdup.test.all.gvalue.sscore.gz",sep="")))
    colnames(gvalue_df) = c("rep","IID","dosage","gvalue")
    gvalue_df = gvalue_df[,c('rep','IID','gvalue')]

    pop.test=fread(F("data/gwas/grid/genotypes/tau100/ss500/iid_test.txt"))
  }
  if(tau==-9){
    gvalue_df =fread(F(paste("data/gwas/grid/genotypes/tau-9/ss500/test/gvalue/genos_grid_d36_m0.07_s500_t-9.rmdup.test.all.gvalue.sscore.gz",sep="")))
    colnames(gvalue_df) = c("rep","IID","gvalue","na")
    gvalue_df = gvalue_df[,c('rep','IID','gvalue')]

    pop.test = fread(F("data/gwas/grid/genotypes/tau-9/ss500/genos_grid_d36_m0.07_s500_t9.test.pop"))
  }

  #lead the polygenic scores
  #prs1=fread(here(paste("gwas/grid/genotypes/tau100/ss500/test/prs/gridt100_prs_",pheno,".all.c.sscore.gz",sep="")))
  prs2=fread(F(paste("data/gwas/grid/genotypes/tau",tau,"/ss500/test/prs/gridt",tau,"_prs_",pheno,".all.c.p.sscore.gz",sep="")))
  prs3=fread(F(paste("data/gwas/grid/genotypes/tau",tau,"/ss500/test/prs/gridt",tau,"_prs_",pheno,".all.nc.sscore.gz",sep="")))

  colnames(prs2)=colnames(prs3)=c("rep","IID","dosage_sum","pcs0","cm","re","cmre")
  #prs1$ascertainment = "all_causal"
  prs2$ascertainment = "causal_p"
  prs3$ascertainment = "lead_snp"

  #rbind polygenic scores and add spatial information
  prs_df=rbind(prs2,prs3)
  prs_df = prs_df %>%
    select(rep,IID,dosage_sum,pcs0,cm,re,cmre,ascertainment)

  prs_df=merge(prs_df,pop.test,by="IID")


  #add genetic value to prs dataframe
  prs_df = merge(prs_df, gvalue_df, by=c("rep","IID"))

  #melt to long format
  mprs_df=melt(prs_df%>%
                 select(-c(dosage_sum,FID)),
               id.vars=c("rep","IID",
                         "gvalue","ascertainment",
                         "deme","longitude","latitude"),
               variable.name="correction",
               value.name="prs")

  #remove variation due to simulated genetic value
  #also calculate the correlation between prs and longitude/latitude
  mprs.adj = mprs_df%>%
    group_by(rep,correction,ascertainment)%>%
    mutate(prs.adjusted = prs-gvalue,
           prs.adjusted = (prs.adjusted - mean(prs.adjusted))/sd(prs.adjusted),
           rlat = cor(prs.adjusted, latitude),
           rlong = cor(prs.adjusted, longitude))%>%
    ungroup()

  #calculate mean prs adjusted for each deme
  mprs.sum = mprs.adj%>%
    group_by(correction,ascertainment,longitude,latitude)%>%
    summarize(mean.prs = mean(prs.adjusted))%>%
    ungroup()

  #calculate mean of rlat and rlong across reps
  mprs.r = mprs.adj %>%
    group_by(correction,ascertainment)%>%
    summarize(rlat = mean(rlat),
              rlong = mean(rlong))%>%
    ungroup()

  labels_prs=c(
    causal_p="Causal",
    lead_snp="Lead SNP",
    pcs0="Uncorrected",
    cm="Common\nPCA",
    re="Rare\nPCA",
    cmre="Common\n+ rare"
  )

  prs_midpoint = mean(mprs.sum$mean.prs)

  if(pheno %in% c("smooth","smooth_long","grandom")){

    plt_prs_phe=ggplot() +
      geom_tile(data = mprs.sum,
                aes(longitude, latitude, fill = mean.prs),
                show.legend = T) +
      theme_bw()+
      facet_grid(correction ~ ascertainment,
                 labeller=as_labeller(labels_prs)) +
      scale_fill_gradient2(high = "#fc8d59",
                           mid = "#ffffbf",
                           low = "#91bfdb",
                           midpoint = prs_midpoint)+
      labs(x="Longitude", y="Latitude", title=plot_title, fill="Mean\nPRS")+
      theme(strip.text = element_text(size=9),
            panel.grid = element_blank(),
            legend.text = element_text(size=9),
            legend.title = element_text(size=10),
            legend.key.size = unit(5, "mm"),
            legend.position="right",
            legend.background = element_blank(),
            plot.background = element_blank(),
            strip.background = element_blank(),
            legend.text.align = 1,
            legend.margin=margin(t=0, r=0, b=0, l=0, unit="cm"))

  }

  if(pheno %in% c("sharp")){

    plt_prs_phe=ggplot() +
      geom_tile(data = mprs.sum,
                aes(longitude, latitude, fill = mean.prs),
                show.legend = T) +
      annotate(geom="text",
               x=0, y=2, label = "*", vjust = 0.7) +
      theme_bw()+
      facet_grid(correction ~ ascertainment,
                 labeller=as_labeller(labels_prs)) +
      scale_fill_gradient2(high = "#fc8d59",
                           mid = "#ffffbf",
                           low = "#91bfdb",
                           midpoint = prs_midpoint)+
      labs(x="Longitude", y="Latitude", title=plot_title, fill="Mean\nPRS")+
      theme(
            strip.text = element_text(size=9),
            panel.grid = element_blank(),
            legend.text = element_text(size=9),
            legend.title = element_text(size=10),
            legend.key.size = unit(5, "mm"),
            legend.position="right",
            legend.background = element_blank(),
            plot.background = element_blank(),
            strip.background = element_blank(),
            legend.text.align = 1,
            legend.margin=margin(t=0, r=0, b=0, l=0, unit="cm"))
  }
  return(plt_prs_phe)
}
Results under the recent structure model.
Make the polygenic score plots for each phenotype for the \(\tau=100\) model.
plts_smooth1_t100 = fmake_plots("smooth",100,"Smooth(N-S)") + labs(title="Recent structure, Smooth phenotype")


#plts_smooth2 = fmake_plots("smooth_long","Smooth(E-W")
plts_sharp_t100 = fmake_plots("sharp",100,"Sharp") + labs(title= "Recent structure, sharp phenotype")

plts_smooth1_t100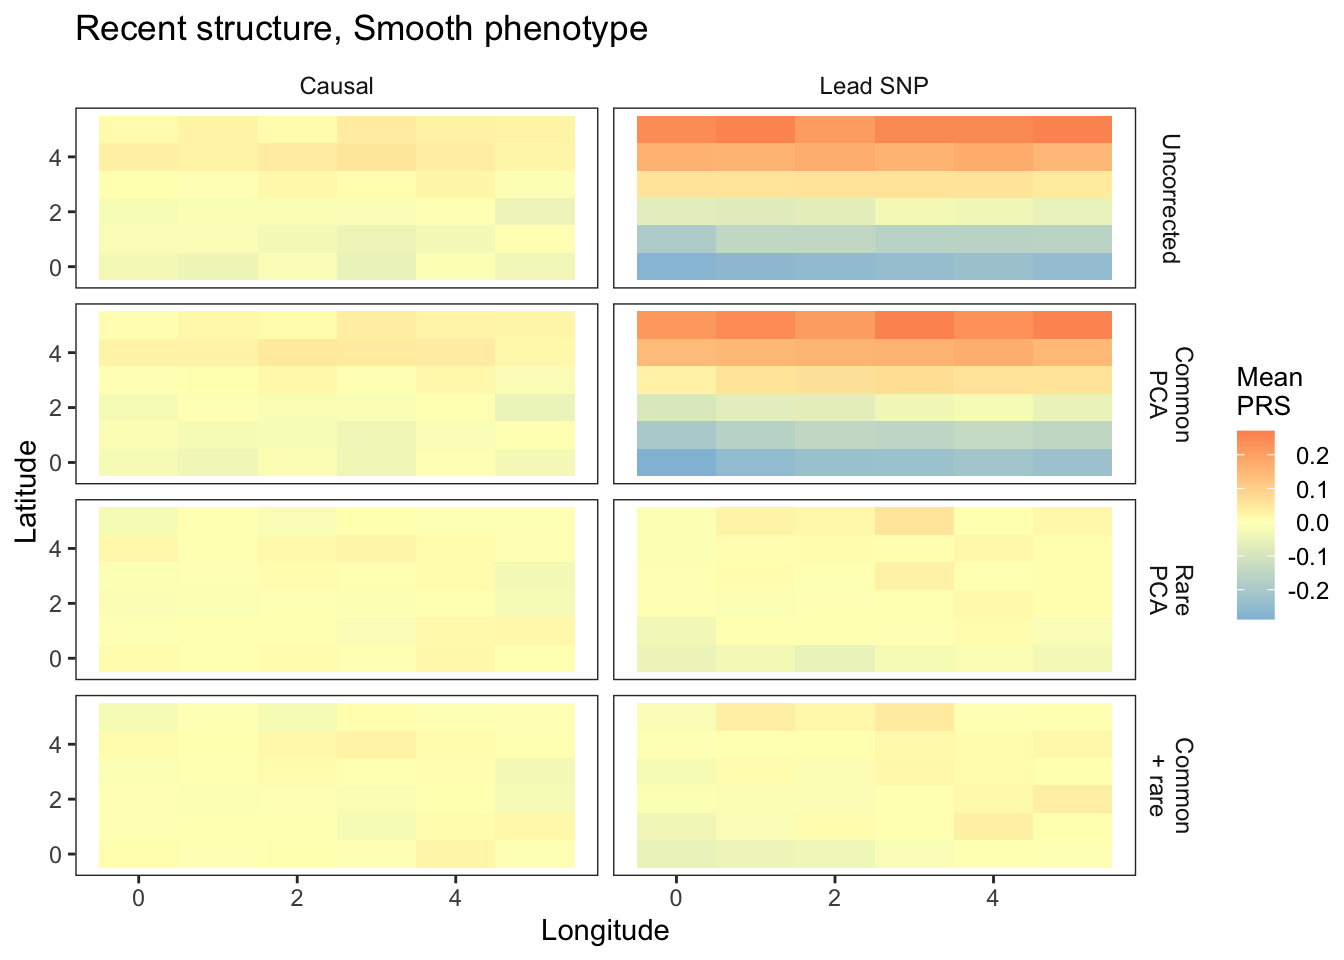
| Version | Author | Date |
|---|---|---|
| 5bce003 | Arslan-Zaidi | 2020-12-22 |
plts_sharp_t100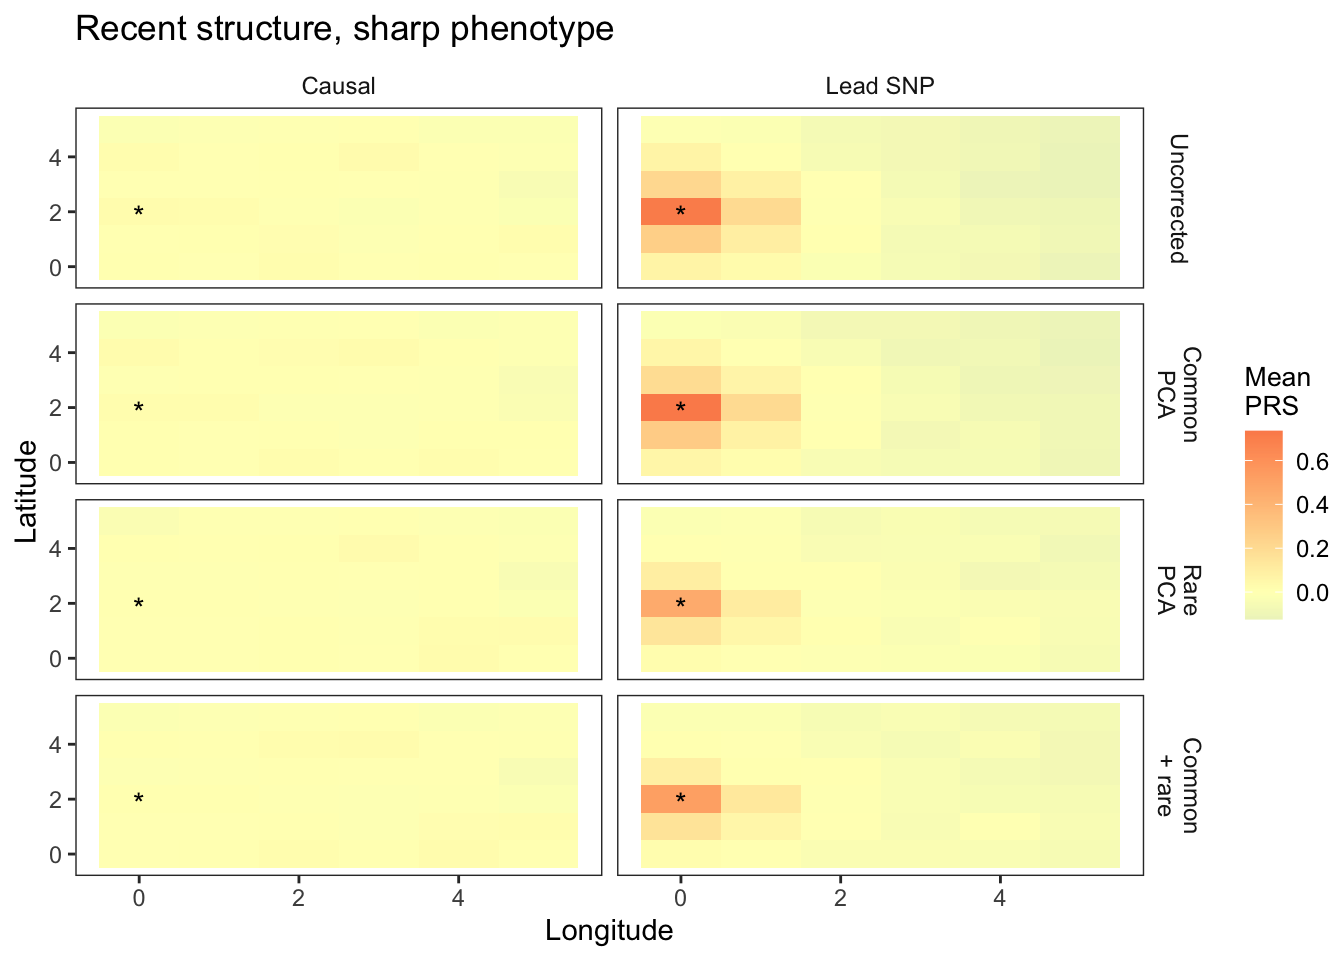
| Version | Author | Date |
|---|---|---|
| 5bce003 | Arslan-Zaidi | 2020-12-22 |
Results under the perpetual structure model.
Make the polygenic score plots for each phenotype for the \(\tau=\infty\) model.
plts_smooth1_t9 = fmake_plots("smooth",-9,"Smooth(N-S)") + labs(title = "Perpetual structure, smooth phenotype")

#plts_smooth2 = fmake_plots("smooth_long","Smooth(E-W")
plts_sharp_t9 = fmake_plots("sharp",-9,"Sharp") + labs(title = "Perpetual structure, sharp phenotype")

plts_smooth1_t9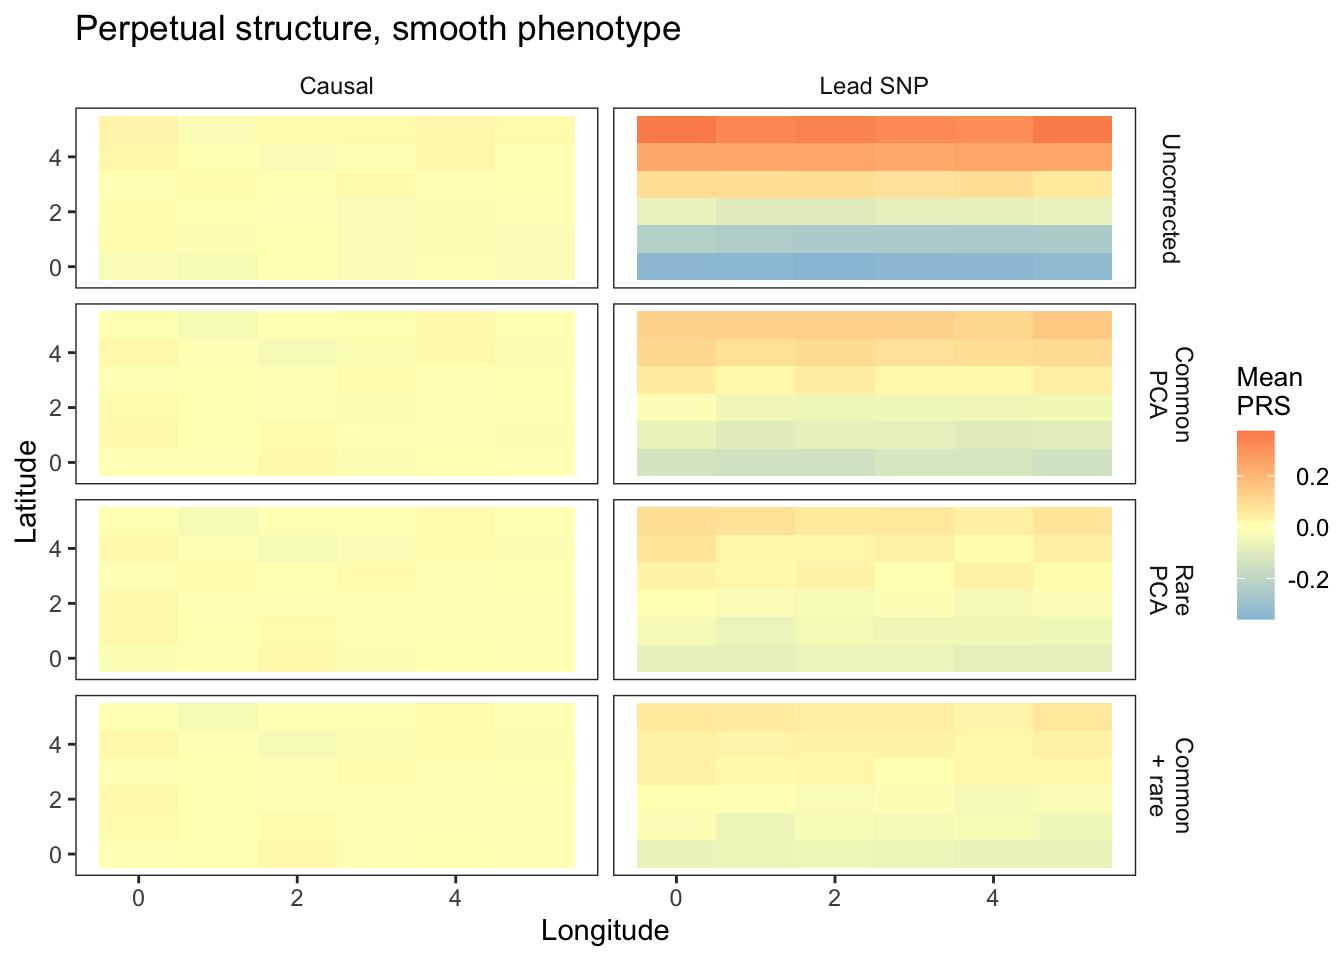
| Version | Author | Date |
|---|---|---|
| 5bce003 | Arslan-Zaidi | 2020-12-22 |
plts_sharp_t9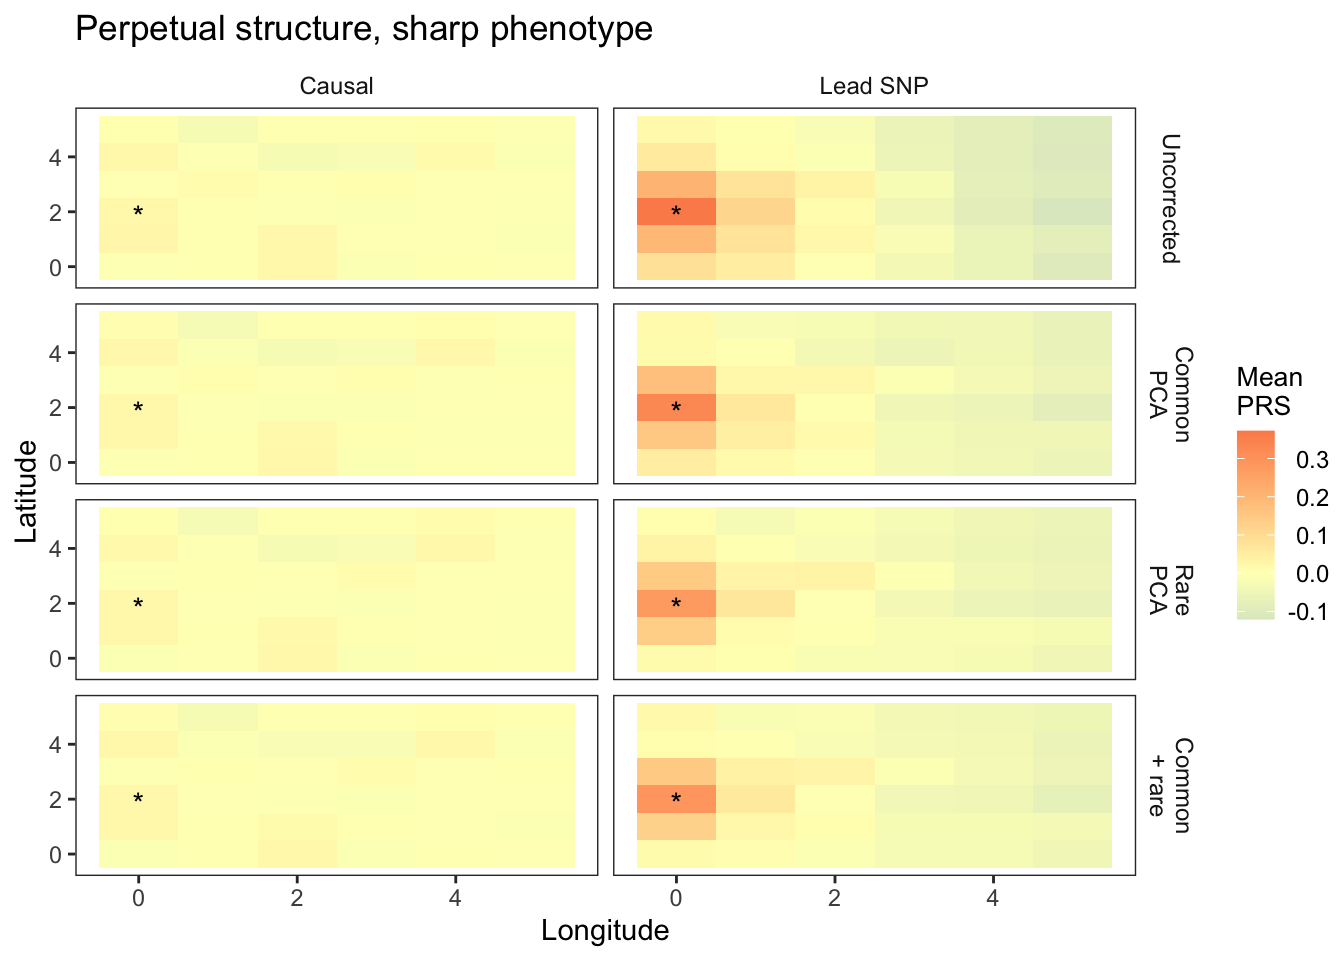
| Version | Author | Date |
|---|---|---|
| 5bce003 | Arslan-Zaidi | 2020-12-22 |
Results under the recent structure model but with LMM effect sizes
Write function to load in summary statistics, genetic values, and plot it all.
fmake_plots= function(pheno,plot_title){

  #load the genetic value
  gvalue_df = fread(F(paste("data/gwas/grid/genotypes/tau100/ss500/test/gvalue/genos_grid_d36_m0.05_s500_t100.rmdup.test.all.gvalue.sscore.gz",sep="")))
    colnames(gvalue_df) = c("rep","IID","dosage","gvalue")
  gvalue_df = gvalue_df[,c('rep','IID','gvalue')]

  #load file with longitude and latitude info
  pop.test=fread(F("data/gwas/grid/genotypes/tau100/ss500/iid_test.txt"))

  #lead the polygenic scores without correction
  prs0.1 = fread(
    F(paste("data/gwas/grid/genotypes/tau100/ss500/test/prs/gridt100_prs_",pheno,".all.c.p.sscore.gz",sep="")))

  prs0.2 = fread(
    F(paste("data/gwas/grid/genotypes/tau100/ss500/test/prs/gridt100_prs_",pheno,".all.nc.sscore.gz",sep="")))

    colnames(prs0.1)=colnames(prs0.2)=c("rep","IID","dosage_sum","pcs0","cm","re","cmre")
    prs0.1  = prs0.1[,.(rep,IID,dosage_sum,pcs0)]
    prs0.2  = prs0.2[,.(rep,IID,dosage_sum,pcs0)]
    prs0.1$correction=prs0.2$correction="pcs0"
    prs0.1$ascertainment="causal_p"
    prs0.2$ascertainment="lead_snp"
    prs0=rbind(prs0.1,prs0.2)
    colnames(prs0)[4]="prs"
    prs0 = prs0%>%
      select(rep,IID,dosage_sum,correction,ascertainment,prs)
    #keep reps 1-10 to match the prs from LMMs
    prs0 = prs0%>%
      filter(rep%in%c(1:10))


  #load prs from LMMs
  prs2=fread(F(paste("data/gwas/grid/genotypes/tau100/ss500/test/prs_mlma/gridt100_prs_p",pheno,".eall.cm.sscore.gz",sep="")))
  prs3=fread(F(paste("data/gwas/grid/genotypes/tau100/ss500/test/prs_mlma/gridt100_prs_p",pheno,".eall.re.sscore.gz",sep="")))


  colnames(prs2)=colnames(prs3)=c("rep","IID","dosage_sum","causal","causal_p","lead_snp")

  prs2$correction="cm"
  prs3$correction="re"

  #rbind polygenic scores and add spatial information
  prs_df=rbind(prs2,prs3)

  mprs_df = melt(prs_df%>%
                   select(-causal),
                 id.vars=c("rep","IID","dosage_sum","correction"),
                 variable.name="ascertainment",
                 value.name="prs")

  mprs_df = rbind(prs0,mprs_df)

  mprs_df=merge(mprs_df,pop.test,by="IID")

  #add genetic value to prs dataframe
  mprs_df = merge(mprs_df, gvalue_df, by=c("rep","IID"))

  #melt to long format
  mprs_df=mprs_df%>%select(-c(dosage_sum,FID))

  #remove variation due to simulated genetic value
  #also calculate the correlation between prs and longitude/latitude
  mprs.adj = mprs_df%>%
    group_by(rep,correction,ascertainment)%>%
    mutate(prs.adjusted = prs-gvalue,
           prs.adjusted = (prs.adjusted - mean(prs.adjusted))/sd(prs.adjusted),
           rlat = cor(prs.adjusted, latitude),
           rlong = cor(prs.adjusted, longitude))%>%
    ungroup()

  #calculate mean prs adjusted for each deme
  mprs.sum = mprs.adj%>%
    group_by(correction,ascertainment,longitude,latitude)%>%
    summarize(mean.prs = mean(prs.adjusted))%>%
    ungroup()

  #calculate mean of rlat and rlong across reps
  mprs.r = mprs.adj %>%
    group_by(correction,ascertainment)%>%
    summarize(rlat = mean(rlat),
              rlong = mean(rlong))%>%
    ungroup()

  labels_prs=c(
    causal_p="Causal",
    lead_snp="Lead SNP",
    pcs0="Uncorrected",
    cm="Common\nLMM",
    re="Rare\nLMM",
    cmre="Common\n+ rare"
  )

  prs_midpoint = mean(mprs.sum$mean.prs)

  mprs.sum$correction=factor(mprs.sum$correction,
                                levels=c("pcs0","cm","re"))

  if(pheno %in% c("smooth","smooth_long","grandom")){

    plt_prs_phe=ggplot() +
      geom_tile(data = mprs.sum,
                aes(latitude, longitude, fill = mean.prs),
                show.legend = T) +
      theme_bw()+
      facet_grid(correction ~ ascertainment,
                 labeller=as_labeller(labels_prs)) +
      scale_fill_gradient2(high = "#fc8d59",
                           mid = "#ffffbf",
                           low = "#91bfdb",
                           midpoint = prs_midpoint)+
      labs(x="Longitude", y="Latitude", title=plot_title, fill="Mean\nPRS")+
      theme(strip.text = element_text(size=9),
            panel.grid = element_blank(),
            legend.text = element_text(size=9),
            legend.title = element_text(size=10),
            legend.key.size = unit(5, "mm"),
            legend.position="right",
            legend.background = element_blank(),
            plot.background = element_blank(),
            strip.background = element_blank(),
            plot.title=element_blank(),
            legend.text.align = 1,
            legend.margin=margin(t=0, r=0, b=0, l=0, unit="cm"))

  }

  if(pheno %in% c("sharp")){

    plt_prs_phe=ggplot() +
      geom_tile(data = mprs.sum,
                aes(longitude, latitude, fill = mean.prs),
                show.legend = T) +
      annotate(geom="text",
               x=0, y=2, label = "*", vjust = 0.7) +
      theme_bw()+
      facet_grid(correction ~ ascertainment,
                 labeller=as_labeller(labels_prs)) +
      scale_fill_gradient2(high = "#fc8d59",
                           mid = "#ffffbf",
                           low = "#91bfdb",
                           midpoint = prs_midpoint)+
      labs(x="Longitude", y="Latitude", title=plot_title, fill="Mean\nPRS")+
      theme(plot.title=element_blank(),
            strip.text = element_text(size=9),
            panel.grid = element_blank(),
            legend.text = element_text(size=9),
            legend.title = element_text(size=10),
            legend.key.size = unit(5, "mm"),
            legend.position="right",
            legend.background = element_blank(),
            plot.background = element_blank(),
            strip.background = element_blank(),
            legend.text.align = 1,
            legend.margin=margin(t=0, r=0, b=0, l=0, unit="cm"))
  }
  return(plt_prs_phe)
}
Plot the PRS distribution.
plts_smooth1_t100 = fmake_plots("smooth_long","Smooth(N-S)") + theme(title=element_blank())

plts_sharp_t100 = fmake_plots("sharp","Sharp") +theme(axis.title.x=element_blank(),title=element_blank())

plts_smooth1_t100 + plts_sharp_t100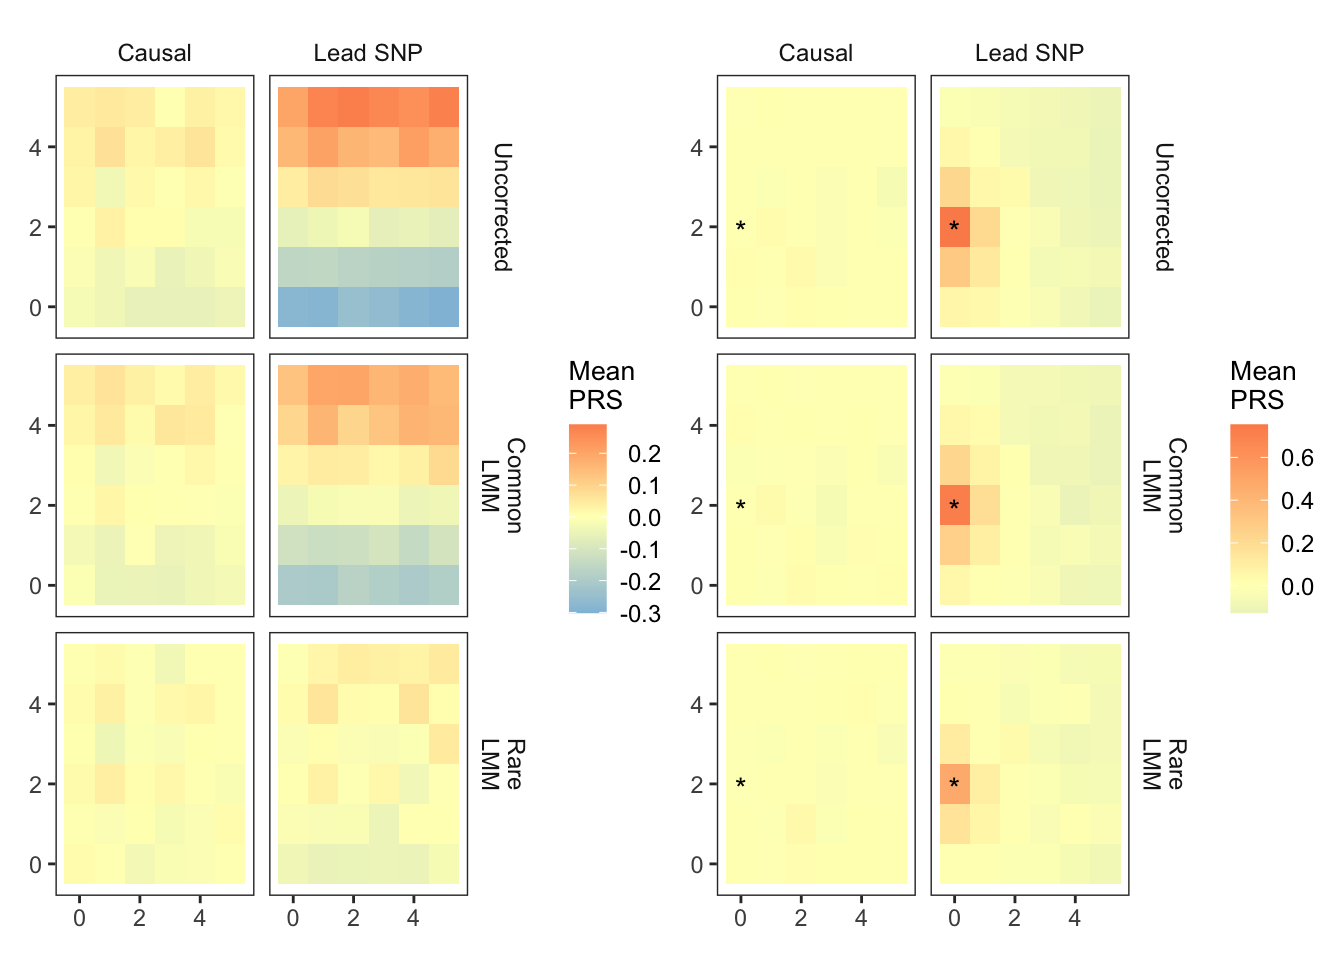
| Version | Author | Date |
|---|---|---|
| 5bce003 | Arslan-Zaidi | 2020-12-22 |
sessionInfo()R version 4.0.3 (2020-10-10)
Platform: x86_64-apple-darwin17.0 (64-bit)
Running under: macOS Catalina 10.15.7
Matrix products: default
BLAS: /Library/Frameworks/R.framework/Versions/4.0/Resources/lib/libRblas.dylib
LAPACK: /Library/Frameworks/R.framework/Versions/4.0/Resources/lib/libRlapack.dylib
locale:
[1] en_US.UTF-8/en_US.UTF-8/en_US.UTF-8/C/en_US.UTF-8/en_US.UTF-8
attached base packages:
[1] stats graphics grDevices utils datasets methods base
other attached packages:
[1] patchwork_1.0.1 rprojroot_1.3-2 data.table_1.13.2 dplyr_1.0.2
[5] ggplot2_3.3.2 workflowr_1.6.2
loaded via a namespace (and not attached):
[1] Rcpp_1.0.5 pillar_1.4.6 compiler_4.0.3 later_1.1.0.1
[5] git2r_0.27.1 R.methodsS3_1.8.1 R.utils_2.10.1 tools_4.0.3
[9] digest_0.6.27 evaluate_0.14 lifecycle_0.2.0 tibble_3.0.4
[13] gtable_0.3.0 pkgconfig_2.0.3 rlang_0.4.8 rstudioapi_0.11
[17] yaml_2.2.1 xfun_0.19 withr_2.3.0 stringr_1.4.0
[21] knitr_1.30 generics_0.1.0 fs_1.5.0 vctrs_0.3.4
[25] tidyselect_1.1.0 grid_4.0.3 glue_1.4.2 R6_2.5.0
[29] rmarkdown_2.5 farver_2.0.3 purrr_0.3.4 magrittr_1.5
[33] whisker_0.4 backports_1.1.10 scales_1.1.1 promises_1.1.1
[37] ellipsis_0.3.1 htmltools_0.5.0 colorspace_1.4-1 httpuv_1.5.4
[41] labeling_0.4.2 stringi_1.5.3 munsell_0.5.0 crayon_1.3.4
[45] R.oo_1.24.0